


Why Hospitality Leadership Development Programs Fail, and How to Fix It
Most leadership development programs fail to change anything once the training ends, and in hospitality it usually comes down to four fixable things. Here they are, in the order worth working through them.


Most hospitality leadership development programs fail, and they do not fail in the way people assume. They are not badly designed, badly delivered or badly attended. They are frequently excellent in the room and produce nothing outside it.
The evidence is unusually blunt on this. Across companies, 66% invest in programs to identify and advance high-potential employees, and only 24% of senior executives at those firms consider the programs a success [1]. Two thirds are buying. Three quarters of the people watching do not believe it is working.
This piece is about the four specific mechanisms by which that happens, why hospitality adds three more of its own, and what actually fixes it. None of the fixes are about the content of the program.
In this article
- The number that explains why leadership development programs fail
- Four holes that make leadership development programs fail
- Why leadership development programs fail to mesh with three things
- How leadership development programs fail by aiming at the wrong thing
- Three ways leadership development programs fail in hospitality
- How to stop leadership development programs failing, in order
- Proving it worked, to somebody who is skeptical
- Glossary
- Frequently asked questions
The stakes, what the research says
of senior executives at firms running high-potential programs consider them a success [1]
have confidence in the rising leaders at their firms, down from 17% three years earlier [1]
US training expenditure in 2025, up 4.9%, while average hours per employee fell to 40 from 47 [2]
of development comes from challenging assignments, and only 10% from coursework
Key insight
The number that explains why leadership development programs fail
Two figures, side by side, describe the whole problem. US training expenditure reached $102.8 billion in 2025, a rise of 4.9%, at an average of $874 per learner, up from $774 the year before. Over the same period, the average employee received 40 hours of training a year, down from 47 [2].
Spend per person rose. Time per person fell. Better efficiency does not explain that combination, because leadership capability is not a thing that gets more efficient. It reflects money moving into shorter, more expensive, more visible interventions, away from the slower work that actually changes how somebody operates.
Set against that is the single most robust finding in the development literature. Roughly 70% of leadership development comes from challenging experiences and assignments, 20% from developmental relationships, and only 10% from coursework and training [3]. That framework emerged from over thirty years of research into how executives actually learn [3].
The mismatch, stated plainly
If 70% of development comes from assignments and 10% from courses, and the budget sits mostly on courses, then most of the money is going to the smallest of the three levers. Everything else in this article follows from that one imbalance.
This is not an argument against structured development. It is an argument that a course with no assignment attached to it does about a tenth of the work. The distinction matters commercially rather than semantically. A group that has bought twelve courses and calls it a leadership pipeline has bought about a tenth of a leadership pipeline, at full price. It will discover this only when a seat opens. What works, almost without exception, is the version where the classroom is the smaller half of the design and a coach or sponsor is watching the other half.
Why this matters
Redirecting existing budget toward assignments and coaching, rather than spending more overall, is the single highest-leverage change available before anything else in this article.
Why this matters
Four holes that make leadership development programs fail
Four holes, and a development effort with any one of them open will underperform regardless of how good the content is.
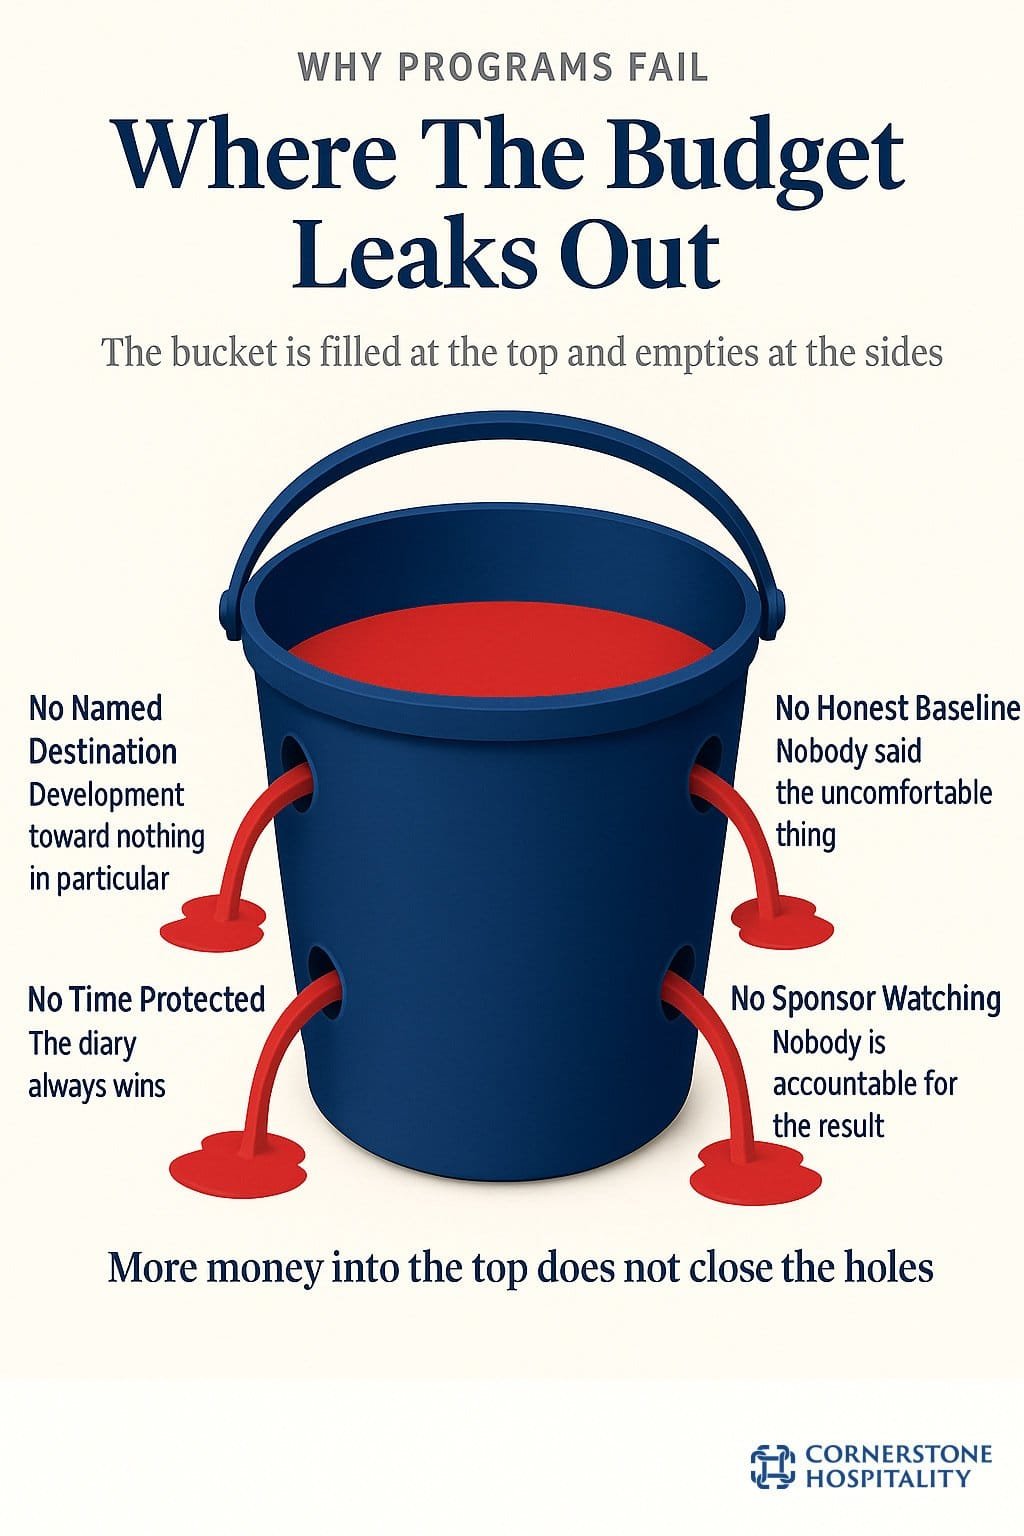
No named destination
Development toward general improvement has nothing to test progress against, so nobody tests anything. Naming the seat or the standard being aimed at is what makes every subsequent decision decidable. Groups skip it because naming a destination for one person implies a judgment about several others.
No honest baseline
Somebody has to say the uncomfortable thing at the start. A structured read from the people above, beside and below a leader will surface something they have not heard, and that discomfort is the mechanism rather than a side effect. Promotions are 1.6X more likely to succeed when assessments inform the selection [4].
No time protected
The diary always wins. In an operating business, an hour of development competes with an hour of trading, and trading has immediate feedback. Unless the structure protects the time, the business reclaims it within six weeks and nobody records that it happened.
No sponsor watching
If nobody senior is accountable for the outcome, the effort has no owner once finance pays the first invoice. Development that nobody observes is indistinguishable from development that did not happen. Finance treats it accordingly at the next budget round.
The hole that stays invisible while the work runs
The fourth hole is the one that most often turns good work into wasted work, because it stays invisible while the engagement is running. Everybody is engaged, the sessions are well received, and eleven months later nobody can say what changed. That is not a failure of the work. It is a failure to have appointed anyone whose job it was to notice.
“The question that predicts whether a development engagement will work is not about the leader at all. It is: who, by name, will be disappointed if this does not produce a change, and what will they do about it. If the honest answer is nobody, the engagement is already decorative.”
Florian Kittler, Managing Partner, Cornerstone Hospitality
What to do
Name a destination, run a real baseline, protect the time on the calendar and appoint a named sponsor. All four have to be true at once. Any one left open is enough to sink the rest.
Not sure where your own leadership development is leaking?
A short, structured read is often enough to see which of the four holes is open.
Key insight
Why leadership development programs fail to mesh with three things
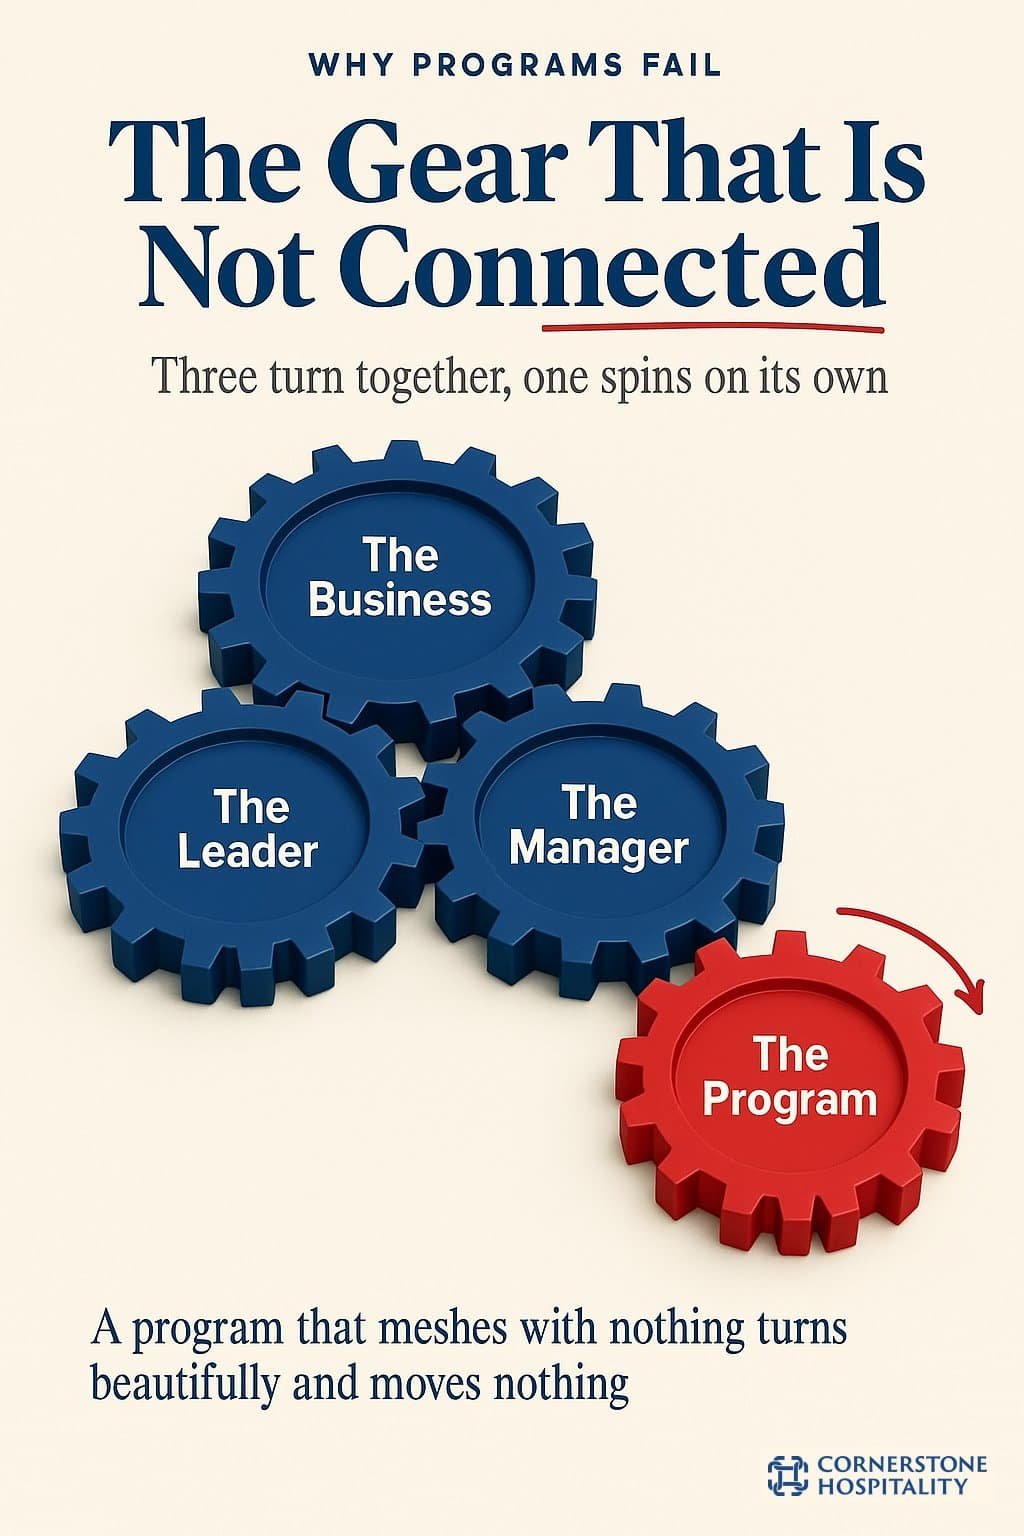
The deeper failure is structural rather than procedural. Leadership development has to mesh with three things: the business it is meant to change, the leader it is meant to develop, and the manager who controls that leader’s week. If it engages with only one of them, it spins.
Meshing with the business means the destination is a real commercial requirement rather than a competency framework. For the leader, meshing means they accept the premise, which cannot be assumed and frequently is. Meshing with the manager is the connection most often left out entirely, and it is the one that determines whether the change actually survives.
The evidence on the manager connection is strong. Gallup finds that managers account for at least 70% of the variance in employee engagement scores across business units, from research covering 27 million employees and more than 2.5 million work units [7].
What the team climate evidence adds
A study, analyzing over 2,700 individuals across 541 teams, finds team climate accounts for up to 31% of the variation in team-level engagement [8]. A leader returns from a development session into a climate that either reinforces the change or erases it, and the manager sets that climate.
There is also a trust problem underneath it. Trust in immediate managers has fallen to 29%, a 37% decline since 2022 [5]. Development that depends on a leader taking a risk and a manager backing them is operating on a resource that is currently in short supply.
What connecting the manager looks like
A conversation at the start, rather than a briefing email. Somebody tells the manager what their person is working on. The manager agrees to one specific thing they will do differently in response, and is asked about it at each of the three milestone reviews. It costs about ninety minutes across a year, and it is most of the difference between an engagement that lands and one that does not.
Why this matters
A leader who accepts the premise and returns to a manager who never heard about it is being asked to change alone. Connecting the manager is the cheapest of the three connections and the one most often skipped.
What to do
How leadership development programs fail by aiming at the wrong thing
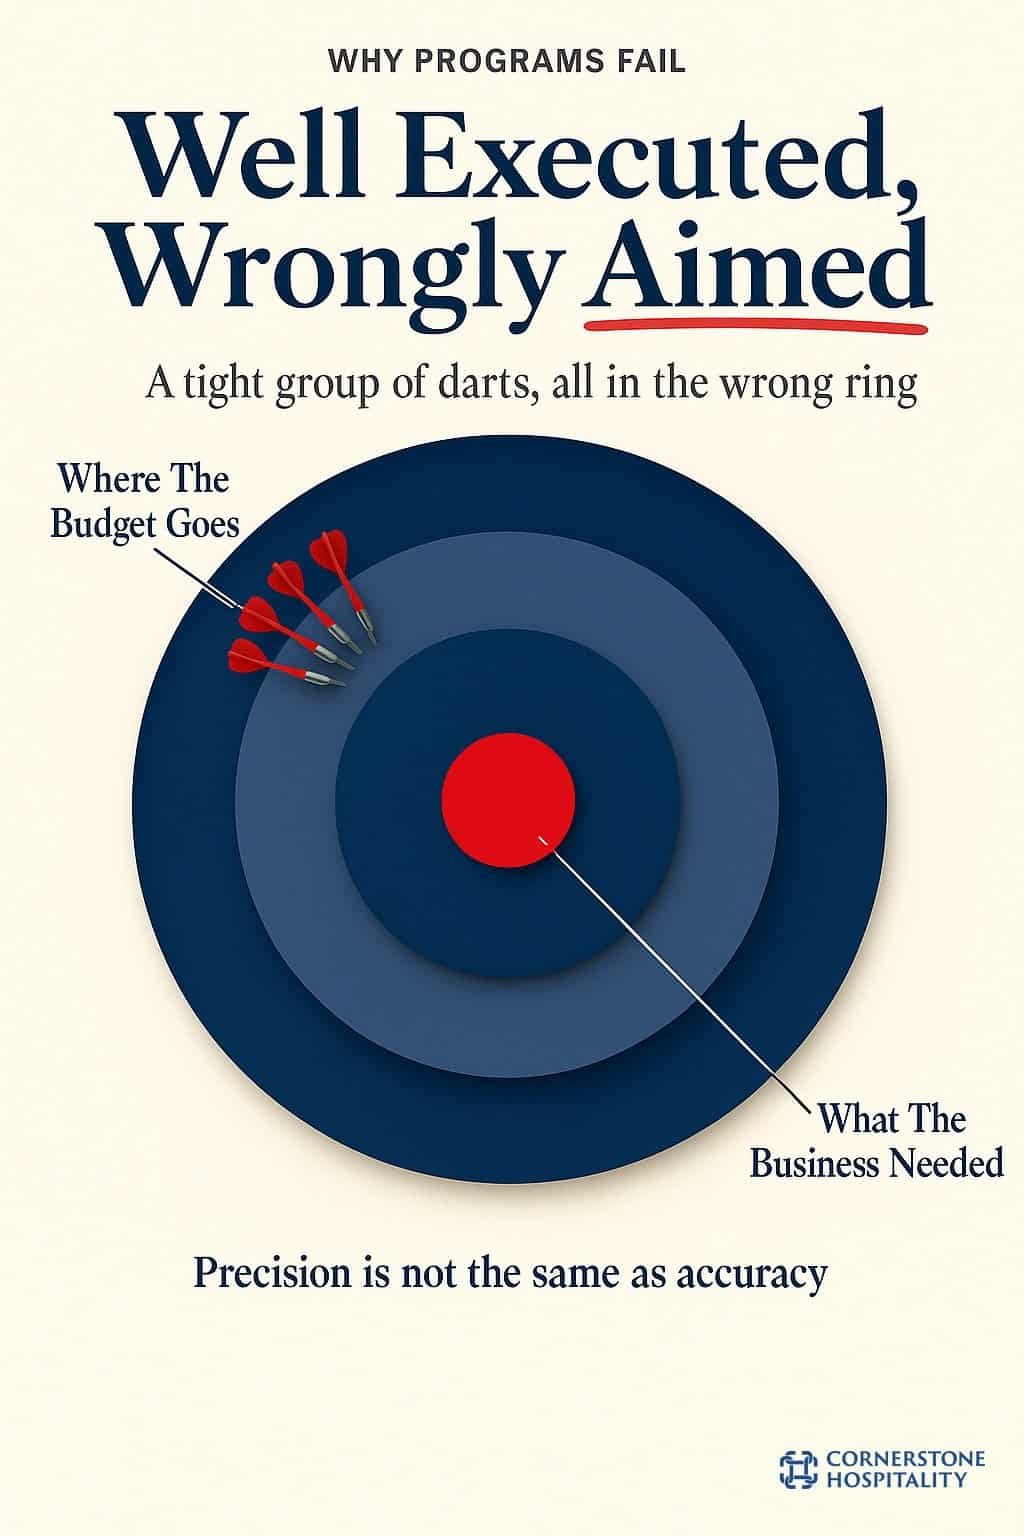
The third mechanism is the most frustrating, because everything about the effort is good except its target. The darts are tightly grouped. They are simply not in the middle.
This happens when a capability model, not a business problem, sets the destination. Capability models are internally coherent and comprehensive. That is exactly what makes them poor targeting devices: they describe everything a leader might need rather than the two things this leader needs next. They are also politically convenient, because a model applies to everybody equally and therefore requires nobody to make a judgment about any individual. That is precisely the judgment development depends on.
It also happens when the program is aimed at the wrong layer. Almost every group funds the executive committee and the graduate intake, and almost none fund heads of department and their deputies.
The layer with the largest measured effect
Yet that middle layer has the largest measured effect on the outcome the industry complains about most. Managers drive at least 70% of engagement variance in their units [7], and hospitality loses 76% of its workforce within a year [12].
And it happens when the effort targets knowledge. Very few senior hospitality leaders are constrained by missing information. In a study of more than 20,000 new hires across 312 organizations, 89% of failures were attributable to attitudinal factors and only 11% to technical skill, with coachability alone accounting for 26% [6]. Targeting what people know only reaches the 11%.
| Aimed at | What it delivers | What it misses |
|---|---|---|
| A capability model | Comprehensive coverage | The two things this leader actually needs next |
| The executive committee | Visible senior engagement | The layer with the largest effect on turnover [7] |
| Knowledge | Confident, better-informed leaders | The 89% of failure that is attitudinal rather than technical [6] |
| A named next seat | A decidable, testable change | Nothing, which is why this is the one that works |
Why this matters
A well-run program aimed at the wrong layer or the wrong lever still fails. Fixing the target costs nothing extra and changes the outcome more than any amount of extra polish on delivery.
Key insight
Three ways leadership development programs fail in hospitality
Beyond the general mechanisms, hospitality adds three of its own.
The first is that the operating rhythm is hostile to the 70. Roughly 70% of development comes from challenging assignments [3], and in hospitality a challenging assignment means accepting a slightly worse result in a business that reports monthly. That trade is real, it is rarely stated out loud, and because it is never stated it is never funded. The consequence is that the classroom part gets bought and the part that does the work does not.
The second is that churn resets the investment. Accommodation and food services recorded a monthly quit rate of 4.3% in March 2026, the highest of any industry and nearly double the private-sector average of 2.2% [11]. Roughly three quarters of separations are people choosing to leave [11]. A development investment in this sector has a materially shorter payback window than the same investment made in a lower-churn industry. This changes the arithmetic of what is worth doing and when.
The third is that the property carries the cost and the group takes the benefit.
Why developing somebody is punished rather than rewarded
A general manager who develops a strong deputy is rewarded by watching that person move to another property. Unless the group counts that as a contribution rather than a loss, the rational move at property level is to develop nobody, and no amount of central exhortation changes that.
The transfer problem
This third failure is an accounting problem wearing the costume of a culture problem. Groups spend years trying to persuade general managers to develop successors, when what is required is a change to how the property is judged. Until developing people improves the developer’s own numbers, it will happen once and then stop.
It is worth adding the current operating context, because it makes all three harder. More than half of hotels describe themselves as somewhat or severely understaffed, with labor costs a top concern for 65% and workforce shortages named by 42% [13]. Development competes for time in properties that do not currently have enough people to run a normal shift. That is a genuine constraint rather than an excuse, and it argues for smaller, better-aimed interventions attached to real assignments rather than for cohort programs that take people off the floor for days at a time.
Wondering how these three play out on your own properties?
An outside view often spots which of the three is doing the most damage in a specific group.
What to do
Change the accounting before changing the message: count outbound promotions as a property result, fund the backfill centrally, and size interventions to a workforce that is already stretched.
What to do
How to stop leadership development programs failing, in order
Five moves. The order matters more than any individual item, because each one makes the next one possible.
1. Name the destination for each person
A seat, a standard or a competency profile, written as one sentence a sponsor would recognize. If it cannot be written that way yet, the engagement is not ready to start.
2. Buy the assignment, not the course
Fund the operational cost of the stretch explicitly, as a line item, with a named acceptable failure. This is where roughly 70% of the development happens [3] and where roughly none of the budget currently goes. In practice this is one-to-one coaching wrapped around the stretch itself, so the person has somebody to think out loud with while the assignment is live, rather than a debrief once it is over.
3. Contract the manager in
Ninety minutes across the year: an opening conversation, an agreed change in their own behavior, and a question at each milestone review. Managers account for at least 70% of engagement variance in their units [7], so this is the highest-leverage ninety minutes available.
5. Appoint somebody who will be disappointed
A named sponsor with three scheduled reviews, rather than a steering committee. One person whose own judgment is visibly attached to the outcome.
The sixth move, for multi-property groups
There is a sixth move that only applies to multi-property groups. It is the one that determines whether the other five survive. Change how a property is judged when it loses a developed person to a group move. Until that transfer is recorded as a contribution, the property is penalized for behavior the group itself is asking for.
One caution on sequencing. The instinct is to begin with a program, because a program is procurable, visible and easy to announce. Beginning with a program produces the 66-to-24 result described at the top of this article [1]. Beginning with the destination and the honest gap analysis produces something smaller, later and better aimed, and it is usually a coaching engagement rather than a course.
Why this matters
The order is the point. Naming a destination before buying an assignment, and contracting the manager before reading people, is what turns five separate good ideas into one system that actually holds.
Key insight
Proving it worked, to somebody who is skeptical
The measurement problem is real, and it is why development budgets are the first thing cut. Most of what gets measured is activity, and activity is unpersuasive to anyone holding a P and L.
| Measure | Use it | Why |
|---|---|---|
| Internal fill rate on critical seats | Yes, as the headline | The only number that describes whether capability actually changed. Three-year rolling, not annual. |
| Named behavioral targets met | Yes | Specific, agreed in advance, and assessable by the sponsor rather than the provider. |
| Retention of the developed group | Yes | High-potential intention to depart rose from 13% in 2020 to 21% in 2024 [5], so this is a live risk rather than a vanity metric. |
| Engagement at the developed layer | Yes | Managers drive at least 70% of engagement variance in their units [7], so it is a forward read on next year’s turnover. |
| Attendance and completion | No | Measures activity. Rises whenever someone needs to demonstrate effort. |
| Program satisfaction | No | Measures the room. Only about a third of L and D functions are proactive in identifying the performance issue before recommending a solution [3]. |
| Training hours delivered | No | Average hours per employee fell to 40 from 47 while spend rose [2], and neither figure describes capability. |
The comparison that actually persuades an owner is the counterfactual cost. External hires are paid about 18% to 20% more than comparable internal promotions and need roughly two years to reach the same performance [10]. A group that develops nobody pays that premium on every senior seat, permanently, and cannot negotiate because it has no alternative.
Counting the departures it prevented
Behind that sits the replacement cost of every departure it failed to prevent. This runs from one-half to two times annual salary on a conservative estimate. 52% of leavers say their manager or organization could have stopped them going [14].
Set beside that, the sector is not shrinking. Travel and tourism is forecast to support 376 million jobs in 2026 and add almost 89 million more over the decade, about a third of all net new jobs globally [16]. The seats are coming either way. The only question is whether they are filled from inside or bought at a premium.
One encouraging figure
72% of hoteliers surveyed say career opportunities in hospitality are better than ever [17]. That belief is the raw material every development effort runs on. It survives most things, but it does not survive being told you are being developed and then watching nothing happen for a year.
A final note on timing. Unaided, a leader typically needs up to six months to reach the point where they contribute as much value as they consume [15]. Most leaders spend ten to fifteen years in leadership positions before receiving any formal training at all [15]. Development that arrives at the right moment is worth several times development that arrives late. This is an argument for reading people early rather than waiting for a vacancy to force the question.
Why this matters
Activity metrics protect a budget for a year at most. Fill rate, retention and named behavioral targets are what survive the next round of cuts, because they describe capability rather than attendance.
Where to start
Related reading
Related reading
Key insight
Glossary
Named destination. The specific seat or standard a development engagement is preparing somebody for, written in one sentence a sponsor would recognize.
Baseline. A structured read from the people above, beside and below a leader, returned as a written plan with named behavioral targets.
The 70-20-10 pattern. The finding that development divides roughly into 70% challenging experiences, 20% developmental relationships and 10% coursework [3].
Sponsor. One named senior person accountable for whether the engagement produced a change. Not a committee.
Transfer problem. The structural issue in multi-property groups where one property bears the cost of developing somebody and another receives the benefit.
Acceptable failure. The agreed level of underperformance that a stretch assignment is permitted to produce without being treated as a mistake.
What our clients and candidates say
Florian played a pivotal role in my career transition within the hospitality industry, combining deep expertise in executive search with a highly strategic advisory approach. Unlike traditional recruiters, he takes the time to truly understand your long term ambitions, challenges your assumptions, and positions you for sustainable leadership success.
Stefan Savic, Hospitality Professional, Asset Management, Development & Strategy
Over the years I have worked with Florian and he has continually provided a service second to none. The caliber of individuals he recommends is always spot on, as he ensures that he understands not only the requirements and expectations of a role but also the importance of the success and growth of the business being related to people.
Daniel Aylmer, Chief Executive Officer, Greater China
About this analysis
The statistics in this piece are drawn from seventeen named third-party studies, industry surveys and government data, cited inline by number and listed in full below with the publisher and the original claim. Cornerstone did not run a primary survey for this article; the analysis and recommendations are Cornerstone’s own reading of that published evidence, not a finding from it.
Ready to build a bench that actually holds?
An honest read on where your own leadership development is leaking takes about four weeks. No commitment, no charge.
What to do
Frequently asked questions
Causes and evidence
Applying it in hospitality
Not sure your own leadership development is actually landing?
An honest read on where it is leaking takes about four weeks. No commitment, no charge.
References
Sources 1 and 2: program investment and whether it is working
- Harvard Business Review: Turning Potential into Success: The Missing Link in Leadership Development: by Claudio Fernández-Aráoz, Andrew Roscoe and Kentaro Aramaki, reports that “66% of companies invest in programs that aim to identify high-potential employees and help them advance” while “only 24% of senior executives at those firms consider the programs to be a success”. It adds that “a mere 13% have confidence in the rising leaders at their firms, down from an already-low 17% just three years ago”, and that at the world’s largest corporations “a full 30% of new CEOs are hired from the outside”: hbr.org/2017/11/turning-potential-into-success-the-missing-link-in-leadership-development
- Training magazine: 2025 Training Industry Report: records that “U.S. training expenditures jumped 4.9 percent to $102.8 billion in 2025” and that “organizations spent $874 per learner this year compared with $774 per learner in 2024”, while average training received fell to “40 hours of training per year vs. 47 hours last year”. Management and supervisory training took 13 percent of the average budget. The survey covers a weighted universe of 152,572 US companies with 100 or more employees: trainingmag.com/2025-training-industry-report
References 3 to 5: the 70-20-10 evidence and the leadership exodus
- Center for Creative Leadership: The 70-20-10 Rule for Leadership Development: sets out the framework that “emerged from over 30 years of our Lessons of Experience research”, in which development divides into “70% challenging experiences and assignments, 20% developmental relationships, 10% coursework and training”. CCL notes the framework is drawn from research spanning China, India, Singapore and the United States and is used across a client base including two thirds of the Fortune 1000: ccl.org/articles/leading-effectively-articles/70-20-10-rule
- DDI: Succession Planning Best Practices: How to Close the Leadership Readiness Gap: reports that “only 20% of HR leaders say they have leaders ready to fill their most critical roles” and that “80% of organizations lack confidence in their leadership bench”, while “75% of organizations prioritize internal promotion over external hiring” and internal candidates “can fill only 49% of critical positions immediately”. It also finds promotions are 1.6X more likely to succeed when assessments inform selection, and organizations with strong benches are 2.9X more likely to fill leadership roles internally and 2.8X more likely to outperform financially: ddi.com/blog/succession-planning-best-practices
- DDI: Global Leadership Forecast 2025 Study Signals Looming Leadership Exodus: surveys 10,796 leaders and 2,185 HR professionals across more than 50 countries and 24 industry sectors, reporting 71% of leaders with increased stress, 40% of stressed leaders considering leaving leadership altogether, and trust in immediate managers at “just 29%, a 37% decline since 2022”. It also records high-potential intention to depart rising “from 13% in 2020 to 21% in 2024”, with high-potential talent 3.7X more likely to leave within a year where the manager does not provide regular growth opportunities: ddi.com/about/media/global-leadership-forecast-2025
Sources 6 to 8: attitude over skill, and the manager’s effect on engagement
- Leadership IQ: Executive Failure Rates: reports a longitudinal study of more than 20,000 new hires across 312 organizations, evaluated by 5,247 hiring managers at 6, 12, 18 and 24 months, finding that “46% of new hires failed within 18 months; only 19% achieved unequivocal success” and that 89% of failures were attributable to attitudinal factors against 11% for technical skill. The leading drivers were coachability at 26%, emotional intelligence at 23%, motivation at 17% and temperament at 15%: leadershipiq.com/blogs/leadershipiq/executive-failure-rates
- Gallup: Managers Account for 70% of Variance in Employee Engagement: states that “managers account for at least 70% of the variance in employee engagement scores across business units”, drawn from research measuring the engagement of 27 million employees and more than 2.5 million work units over two decades. It also finds about one in 10 people possess high talent to manage, that companies “miss the mark on high managerial talent in 82% of their hiring decisions”, and that talented managers contribute about 48% higher profit than average managers: news.gallup.com/businessjournal/182792/managers-account-variance-employee-engagement
- Korn Ferry Institute: Stronger Leadership, Stronger Climate, Better Results: analyzes “data from over 2,700 individuals across 541 teams” and finds that “team climate accounted for up to 31% of the variation in team-level engagement”. It reports that the right leadership characteristics and team environment “can lift engagement scores by up to 42 percentile points”, and that leaders scoring high on Presence, Agility and Striving produced team climates “approximately 30 percentile points stronger” than lower-scoring leaders: kornferry.com/institute/stronger-leadership-stronger-climate-better-results
References 9 to 11: selection validity, external-hire cost and hospitality’s quit rate
- Society for Industrial and Organizational Psychology: Is Cognitive Ability the Best Predictor of Job Performance? New Research Says It’s Time to Think Again: reports the revised operational validity estimates from Sackett and colleagues, in which “structured interviews emerged as the strongest predictors of job performance” with a mean operational validity of .42, job knowledge and work sample tests follow at .40, .38 and .33, and “cognitive ability rounded out this list with a validity estimate of .31”. The article explains that earlier meta-analytic corrections had systematically inflated these figures: siop.org/tip-article/is-cognitive-ability-the-best-predictor-of-job-performance
- Knowledge at Wharton: Why External Hires Get Paid More, and Perform Worse, than Internal Staff: reports Matthew Bidwell’s study “Paying More to Get Less: The Effects of External Hiring versus Internal Mobility”, published in Administrative Science Quarterly and drawn from personnel data in a US investment banking division from 2003 to 2009. External hires are paid “about 18% to 20% more” than comparable internal promotions and need “about two years to get up to speed”, and hiring managers confirm they “typically pay 10% or 20% more to pull people out of positions” where they already have security: knowledge.wharton.upenn.edu/article/why-external-hires-get-paid-more-and-perform-worse-than-internal-staff
- OysterLink analysis of US Bureau of Labor Statistics JOLTS data: Hospitality Workers Quit at a Higher Rate Than Any Other Industry in the U.S.: establishes that “the quit rate for accommodation and food services reached 4.3% in March 2026, the highest among all industries” and “nearly double the private-sector average of 2.2%”. Retail trade, the next highest sector, recorded 3.1%, against healthcare at 1.9%, manufacturing at 1.4% and finance at 1.2%. Layoffs in the sector held at 1.3%, matching the national average, so roughly three-quarters of separations are people choosing to leave: prnewswire.com/news-releases/hospitality-workers-quit-at-a-higher-rate-than-any-other-industry-in-the-us
Sources 12 to 14: frontline turnover, staffing shortages and replacement cost
- Deloitte: Frontline Workforce Trends in Airlines, Hospitality, and Restaurants: reports that “80% of restaurant workers and 76% of hospitality workers leave their job within a year”, and that “66% of executives and managers say most recent hires were not fully prepared, and that lack of experience was the most common failing”. It also finds 82% of workers naming feeling happy and engaged at work as the key driver of productivity, and 75% hoping for greater stability in the face of change: deloitte.com/us/en/Industries/consumer/articles/frontline-workforce-human-capital-trends
- American Hotel & Lodging Association: Rising Cost, Staffing Challenges Persist for Hotels as Travel Demand Expected to Hold Steady: surveys 246 hoteliers in late February 2026 and finds that “more than half of respondents report their properties are somewhat or severely understaffed”, with labor costs a top concern for 65% and workforce shortages named by 42%. Retention incentives in use include higher wages at 70%, flexible scheduling at 54%, hotel discounts at 54% and enhanced benefits at 31%: ahla.com/news/rising-cost-staffing-challenges-persist-hotels
- Gallup: This Fixable Problem Costs U.S. Businesses $1 Trillion: establishes that “the cost of replacing an individual employee can range from one-half to two times the employee’s annual salary” and describes that as “a conservative estimate”. It also reports that 52% of voluntarily exiting employees say their manager or organization could have prevented their departure, and 51% say that in the three months before leaving, neither their manager nor any other leader spoke with them about job satisfaction or their future: gallup.com/workplace/247391/fixable-problem-costs-businesses-trillion
References 15 to 17: transition timing, sector growth and staffing shortages
- The Future Organization, interview with Michael Watkins: The First 90 Days: Strategies for Leaders in Transition: records Watkins stating that “unaided the process for leaders to reach the breakeven point can take up to six months”, the breakeven point being where a leader contributes as much value as they have consumed. He also observes that “most people spend 10 to 15 years in leadership positions before getting any formal leadership training from their organization”, with the average leader in their late thirties or early forties before any training at all: thefutureorganization.com/the-first-90-days-strategies-for-leaders-in-transition
- World Travel & Tourism Council: Global Travel & Tourism Growth to Outpace Wider Economy by 1.5 Times Over the Next Decade: published 12 May 2026 with research partner Oxford Economics, forecasts that the sector will “support 376 million jobs worldwide in 2026, representing one in nine jobs globally” and contribute “$12TN to the world economy, accounting for 9.9% of global GDP”. Over the next decade it projects “almost 89 million new jobs globally, accounting for approximately one-third of all new jobs expected” across the wider economy: wttc.org/news/global-travel-tourism-growth-to-outpace-wider-economy-by-1-5-times-over-the-next-decade
- American Hotel & Lodging Association: 65% of surveyed hotels report staffing shortages: surveys 282 hoteliers between 6 December 2024 and 3 January 2025 with Hireology, finding 65% still reporting shortages, 9% describing themselves as “severely understaffed” against 13% in May 2024, hotel employment “nearly 10% below pre-pandemic staffing levels”, and 71% carrying open positions at an average of six to seven per property. Housekeeping accounts for 38% of the gaps and front desk 26%, and 72% of respondents say career opportunities in hospitality are better than ever: ahla.com/news/65-surveyed-hotels-report-staffing-shortages
For the broader picture this fits into, see our Leadership Development work.
About the author
Written by
Florian Kittler, ISHC
Managing Partner, Cornerstone Hospitality, Global Practice Leader, Hospitality, Travel & Leisure
Florian leads Cornerstone International Group’s global Hospitality, Travel & Leisure Practice. He brings seventeen years of senior hospitality experience, including Marriott, Hyatt, IHG, Mandarin Oriental, and Shangri-La Hotels & Resorts, and sixteen years in retained executive search. He is bilingual in English and German and works across Europe, the Middle East, the Americas, and Asia Pacific.