


Building a Leadership Pipeline in Hospitality
A leadership pipeline in hospitality: building one is a decision, not a shortage. Here is where it narrows, what keeping it open costs, and what it returns.


A leadership pipeline in hospitality does not fix itself with a bigger recruiting budget. The groups that keep a leadership pipeline in hospitality healthy review it on a calendar, not only when a seat opens.
A leadership pipeline in hospitality is only as strong as its weakest transition point, not its total headcount. Building a leadership pipeline in hospitality means naming who is one promotion away at every level, not just at the top. Most operators can describe their leadership pipeline in hospitality in general terms but cannot name the three people who would fill a general manager vacancy tomorrow, and that is where a leadership pipeline in hospitality actually breaks.
A leadership pipeline in hospitality is agreed upon at every strategy offsite and then has to compete with the operating year. Everyone agrees it matters. The harder question is which decision in the past twelve months was made differently because of it.
That is not carelessness. It is arithmetic. A hospitality group runs on a daily cycle that produces immediate, visible, and measurable feedback. A leadership pipeline produces nothing measurable for two to four years. Put those two things in the same diary, and the diary wins, every time, in every group, regardless of how sincerely the intention was held in January.
This piece is about what a pipeline actually is, where it narrows, why the narrowing is always a decision rather than a shortage, and what it costs to keep the thing open. It is written from the other side of the table: we run searches for these seats. That means we see, in real time, which groups can promote and which have to buy.
In this article
- The arithmetic is worth running first
- Where the leadership pipeline in hospitality actually narrows
- Performance is not the same as potential
- The layer nobody develops
- What a working leadership pipeline in hospitality costs and what it returns
- How to build a leadership pipeline inside a hospitality group
- What to measure and what to ignore
- Glossary
- Frequently asked questions about the leadership pipeline in hospitality
The stakes, what the research says
20%
of HR leaders say they have leaders ready to fill their most critical roles
49%
of critical positions can be filled immediately by internal candidates, against 75% of groups that say they prioritize internal promotion
4.3%
monthly quit rate in accommodation and food services, the highest of any industry and nearly double the private sector average
376m
jobs the travel and tourism sector is forecast to support in 2026, one in nine jobs globally
KEY INSIGHT
The arithmetic is worth running first
Start with the demand side, because it is the part that is easy to underestimate. Travel and tourism is forecast to support 376 million jobs worldwide in 2026, roughly one in nine jobs on the planet, and to add almost 89 million more over the coming decade, about a third of all net new jobs across the entire world economy [11]. Every one of those additions sits underneath somebody. The leadership requirement is not a fixed number that a group can staff once and forget, it grows with the estate.
Now the supply side. Only 20% of HR leaders say they have leaders ready to fill their most critical roles. 80% of organizations report a lack of confidence in their leadership bench. That gap has been widening rather than closing, and it is not confined to hospitality. What is specific to hospitality is the volatility underneath it.
Accommodation and food services recorded a monthly quit rate of 4.3% in March 2026, the highest of any industry tracked and nearly double the 2.2% private sector average, against 3.1% in retail, 1.9% in healthcare, and 1.2% in finance [10]. Layoffs held steady at 1.3%, in line with the national figure. That means roughly three quarters of all separations in the sector are people choosing to walk [10].
What turnover does to the same arithmetic
Deloitte puts the annual figure more starkly still: 76% of hospitality workers and 80% of restaurant workers leave their jobs within a year [15]. At the same time, 65% of surveyed hotels still report staffing shortages, and hotel employment sits nearly 10% below pre pandemic levels. 71% of properties are carrying open positions [3].
Set those numbers beside each other, and the shape of the problem becomes clear. Hospitality has the fastest growing leadership requirement of almost any sector and the fastest churning population from which to fill it. A pipeline in this industry is not a nice to have piece of talent hygiene. It is the only mechanism by which the estate can be led at all in five years.
Why this compounds
Somebody already busy temporarily fills every unfilled senior seat in a hospitality group. That person then has less time for the very development work that would have prevented the next gap. A pipeline decays in a loop rather than in a straight line, and the loop speeds up.
A second, uncomfortable reason explains why nobody does the arithmetic. The people best placed to build a pipeline are the same people whose own results depend on not losing their strongest deputies. Developing a brilliant director of operations rewards a general manager only with watching that person leave for a property across town. Unless the group counts that as a win rather than a loss, no rational operator will do it twice.
Why this matters
A pipeline is not built once and left. Growing demand plus the highest churn rate of any industry means the gap widens on its own unless a named person is deliberately closing it every quarter.
KEY INSIGHT
Where the leadership pipeline in hospitality actually narrows
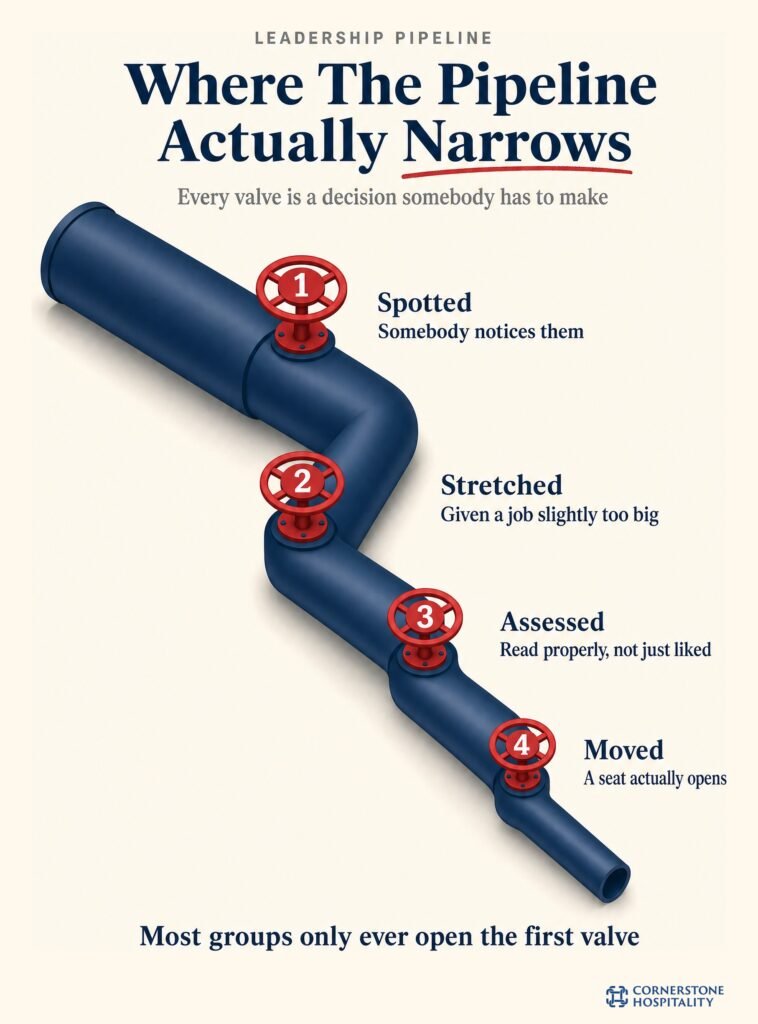
The word “pipeline” is doing a lot of work in most conversations, and usually the wrong work. It suggests a passive conduit, something that fills up if you pour enough in at one end. In practice it behaves like a pipe with valves on it. Every valve is a decision that a named person either makes or does not make.
There are four of them, and they narrow in sequence.
The four valves
1. Spotted
Somebody with authority notices the person and says so out loud to somebody else. Until that happens, the person exists only inside their department. Whether their immediate manager is generous or territorial entirely determines their prospects.
2. Stretched
The group gives them a job slightly too big for them, with enough support that failing is survivable. Almost all real leadership growth happens here, and almost no group does it deliberately, because the stretch assignment is also an operational risk in a live business.
3. Assessed
Somebody reads them properly rather than simply liking them. People most often skip this valve entirely, because it feels redundant when everyone already has an opinion. It is the one that most reliably predicts whether the promotion works [1].
4. Moved
A seat actually opens at the moment they are ready for it in a location they will accept. This valve has the most luck in it. It is the reason a pipeline needs to be wider than the vacancy forecast rather than exactly the size of it.
Valve one tends to run well on its own. Leaders have to open the other three deliberately.
Valve one is open and the other three are shut
Managers notice people constantly. The industry is unusually good at recognizing talent in the moment because the work is visible and the feedback is immediate. What follows the noticing is the part worth attention.
It is also the valve where failure is most expensive to discover late: in a study of more than 20,000 new hires, 46% failed within 18 months, and 89% of those failures were attributable to attitude rather than technical skill [8]. The stretch valve fails for an operational reason rather than a philosophical one. Giving somebody a job slightly too big means accepting a slightly worse result for a period in a business where the result is published monthly. Few people ever state the honest version of that trade, which is why groups rarely fund it.
The assessment valve fails for a different reason: it feels like bureaucracy. Everybody in the room already has a view on whether Ana is ready. The trouble is that the room’s view is a composite of who has seen her in a crisis, who likes her, and who last worked with her. DDI finds that promotions are 1.6X more likely to succeed when assessments inform the selection [1], and that gap exists precisely because a considered read and a confident opinion are not the same instrument.
The most expensive words in a talent review are “we all know she is ready”. Sometimes that is true. When it is not true, nobody in the room finds out for eighteen months, and by then the property has paid for it and so has she.
Florian Kittler, Managing Partner, Cornerstone Hospitality
What to do
Put a name against each of the four valves for every critical seat, not just the first one. If nobody can say who runs the stretch assignment or the assessment for a given seat, that valve is shut regardless of how well someone was spotted.
WHY THIS MATTERS
Performance is not the same as potential
The single most common failure in a hospitality talent review is treating this year’s numbers as a forecast of next year’s capability. It is an understandable mistake. Performance is measurable, recent, and defensible, and potential is none of those things.
But the two axes genuinely come apart, and they come apart in both directions. Some strong performers are excellent exactly where they are, and the next seat up would diminish them, because what makes them exceptional is a proximity to the operation that the bigger job removes. Other people deliver unremarkable numbers in a badly designed seat, and a change of scope would transform them.
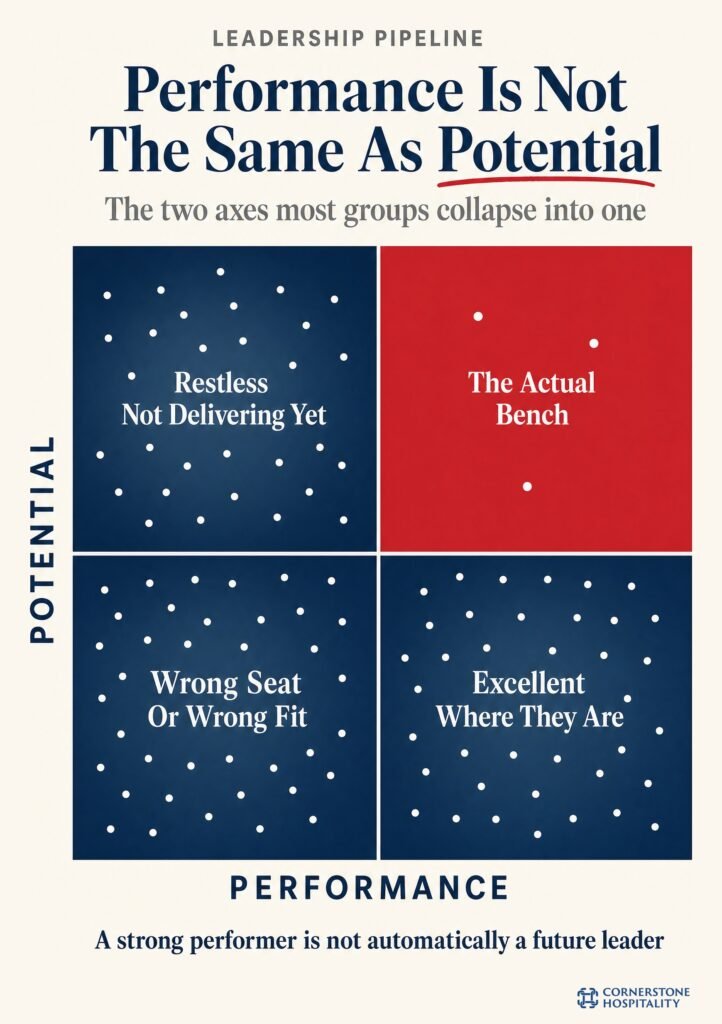
The consequences of collapsing the two axes are documented and expensive. Across companies, 66% invest in programs to identify and advance high potential employees, and only 24% of senior executives at those same firms consider the programs a success [9]. Confidence in the rising bench has actually fallen, with a mere 13% expressing confidence in their firms’ rising leaders, down from an already low 17% three years earlier [9].
The reason is not that managers run the programs badly.
What collapsing the two axes costs
It is that the selection into them is being made on the wrong axis. So the development budget lands on people who were already excellent where they were and misses the people whose ceiling was genuinely higher than their current numbers implied.
What a proper read adds
A structured assessment is not a scoring exercise for its own sake. It exists to separate three things that look identical from the outside: how well somebody is currently performing, how well they could perform in a differently shaped job, and how they will behave when the job stops giving them daily feedback. Structured methods now show the highest measured predictive validity of any single selection instrument, at .42 against .31 for cognitive ability alone [12].
It is worth being precise about what those validity figures mean, because people routinely oversell them. A validity of .42 is not a guarantee. It is a meaningful edge over a coin flip and a massive edge over an unstructured conversation. In a group promoting fifteen people a year into consequential seats, an edge of that size is the difference between two bad appointments and five.
Why this matters
A performance review and a potential read are two different instruments. Running only the first one means the development budget keeps finding the same people, and the ones with the real headroom stay invisible.
Building a bench, or reading one properly?
A structured assessment tells you which of your strong performers are ready for the next seat, before you find out the hard way.
WHY THIS MATTERS
The layer nobody develops
Ask a hospitality group where its leadership development budget goes, and the answer is usually one of two places: the executive committee or the graduate intake. Both are defensible. Together they exclude the layer that actually determines whether the pipeline works.
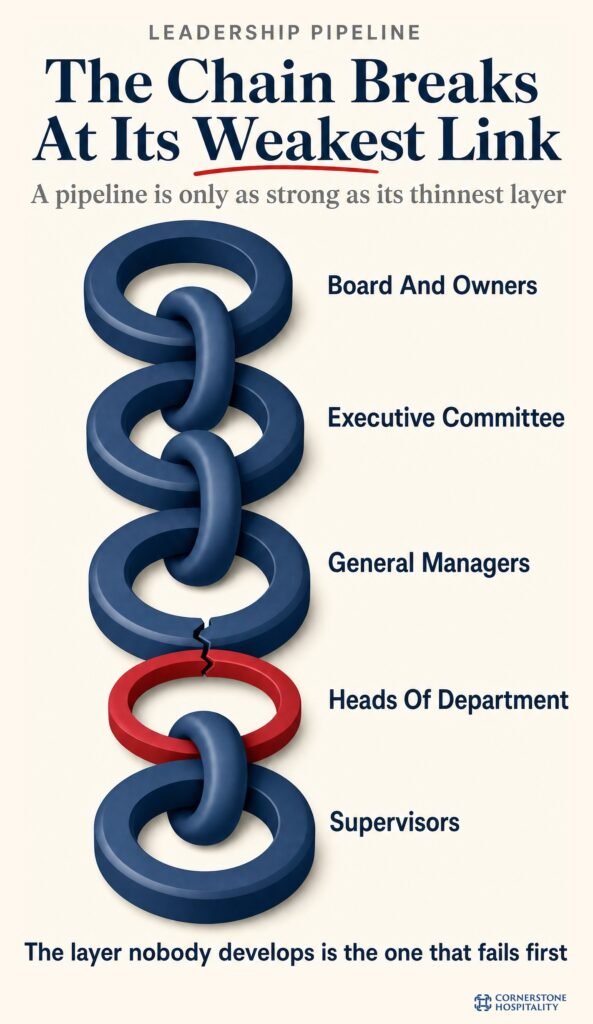
That layer is heads of departments and their immediate deputies. It is the last rung at which a person is still fundamentally doing the work. The first is when they are fundamentally responsible for other people doing it. More than half of hotels now describe themselves as somewhat or severely understaffed, with workforce shortages named as a top concern by 42% [4], which means this layer is doing the job under permanent pressure. Every general manager in the industry passed through it. Almost none of them had prepared for it at the time.
The cost of leaving it undeveloped is not abstract. Gallup’s work across 27 million employees and more than 2.5 million work units finds that managers account for at least 70% of the variance in employee engagement scores across business units [6]. In a sector where three quarters of separations are voluntary [10] and 76% of the workforce leaves within a year [15], the quality of the manager immediately above the frontline is not a soft factor. It is the retention strategy.
The evidence for the layer that gets skipped
A study’s analysis of more than 2,700 individuals across 541 teams puts a number on the same mechanism from the other direction: team climate accounted for up to 31% of the variation in team level engagement, and the right leadership characteristics lifted engagement scores by as much as 42 percentile points [14].
So the layer that groups develop least is the layer with the largest measured effect on the outcome the industry complains about most. That is not a coincidence, and it is not bad luck. It is a budget allocation, made annually, by people who would change it if they saw it written down.
| Layer | Typical development spend | Measured effect on outcome |
|---|---|---|
| Board and owners | High per head, low volume | Real but slow and largely about strategy rather than climate |
| Executive committee | High per head | Substantial, and the layer most groups already fund |
| General managers | Moderate, usually reactive | Large. This is where the property result is actually set |
| Heads of department | Low to none | Largest measured effect on engagement and therefore retention [6] [14] |
| Supervisors | Near zero beyond compliance | Where 76% annual turnover is either created or prevented [15] |
The blunt version
If a hospitality group could only afford to develop one layer, the evidence points at heads of departments and their deputies rather than at the executive committee. Almost no group allocates that way, because the executive committee sets the budget.
WHY THIS MATTERS
What a working leadership pipeline in hospitality costs and what it returns
Two costs are worth separating, because groups conflate them and then conclude the whole thing is unaffordable.
The first is program cost. US training expenditure reached $102.8 billion in 2025, averaging $874 per learner across all training, with management and supervisory training taking about 13 percent of the typical budget [16]. At that scale, developing a hospitality group’s head of department layer is a rounding error against payroll. It is not the expensive part.
The second is opportunity cost, and this is the real one. A stretch assignment carries operational risk. A cohort program takes people off the floor. A structured assessment takes senior time. None of these appear as a line item, and the person whose numbers take the hit this quarter feels all of them immediately.
Against that, the return side. Organizations with strong benches are 2.9X more likely to fill leadership roles internally and 2.8X more likely to outperform financially. Internal promotions succeed at markedly higher rates where the leader participated in cohort development, experienced sequential leadership learning, or received frequent manager coaching.
And there is a direct, calculable saving on the buy side.
What the external premium looks like in practice
External hires are paid about 18% to 20% more than comparable internal promotions, and hiring managers confirm they typically pay a 10% to 20% premium to pull somebody out of a position where they already have security [5]. External hires also need about two years to reach the performance level of an internal promotion into the same job [5].
2.9X
more likely to fill leadership roles internally, for organizations with a strong bench
18-20%
pay a premium on an external hire against a comparable internal promotion
2 years
for an external hire to reach the performance of an internally promoted peer
0.5-2x
annual salary, the conservative cost of replacing a single employee [7]
None of this is an argument that external hiring is a mistake. It plainly is not, and roughly 30% of new CEOs at the world’s largest corporations are hired from outside for perfectly sound reasons [9]. New capability, a repositioning, a market nobody internally understands: all of those genuinely call for an outside appointment.
The argument is narrower and harder to dismiss. A group that cannot promote from within pays the external premium on every senior vacancy, waits two years for performance on each one, and negotiates every time from the weakest possible position, which is having no alternative. Building the bench does not remove external hiring. It removes the obligation.
Why this matters
The premium on an external senior hire is not a one off cost. It repeats on every vacancy a group cannot fill from within, which is exactly why the return on a pipeline compounds the same way the cost of neglecting one does.
Paying the external premium on every senior vacancy?
If the last three senior appointments all went outside, that pattern is worth an honest look. No commitment, no charge.
WHAT TO DO
How to build a leadership pipeline inside a hospitality group
What follows is not a framework. It is the sequence that works in practice in multi property groups, in the order that survives an operating year.
Name the seats, not the people
Start with the twelve to twenty seats where a vacancy would genuinely hurt. The consequence list rather than the org chart. The list is usually shorter and stranger than expected, and two of the seats often have no obvious successor at all.
Put two names against each seat
Two, not one. A single successor is not a pipeline, it is a dependency. It usually collapses the moment that person is approached by somebody else. Where a seat has no second name, that is the finding. It goes on the page as a gap rather than a quietly softened figure.
Read the names properly
A structured assessment on each, run by somebody outside the reporting line. Promotions are markedly more likely to succeed when assessments inform the selection. The read is worth most on the people everyone is already confident about.
Design one stretch per person per year
One assignment, named, with a defined support structure and an agreed acceptable failure. The stretch is the development. Everything else is preparation for it or reflection on it.
Make the loser whole
If a general manager loses a strong deputy to a group move, the group has to visibly reward that loss rather than quietly absorb it. Until developing people is good for the developer’s own numbers, it will not happen twice.
Review it four times a year
Annual talent review is a ceremony. Quarterly is a process. The difference is whether a person who became ready in March waits nine months for anyone to notice.
The step almost every group skips
The step group most often skipped is the fifth. It is the one that determines whether the other five survive. A pipeline is a transfer of value between properties: one property invests, another benefits. Unless the accounting recognizes that, the system simply penalizes the investing property for good behavior, and it will stop.
Every group we work with says it promotes from within. The test is not the policy, it is what happened the last three times a senior seat opened. Two out of three from inside is a real pipeline. Nought out of three, with a good explanation each time, is a story about a pipeline.
Florian Kittler, Managing Partner, Cornerstone Hospitality
One further point on sequencing. There is a strong temptation to begin with a program, because a program is visible, procurable, and easy to announce. Beginning with a program almost always produces the 66 to 24 outcome documented above: heavy investment, low executive belief in the result [9]. Beginning with the seat list and the honest gap analysis produces a smaller, cheaper, better aimed program six months later. It is worth remembering how late formal development usually arrives: most leaders spend ten to fifteen years in leadership positions before receiving any formal training at all [13].
What to do
Run the six steps in order and do not skip the fifth. A group that names seats, assesses properly, and stretches people but never rewards the manager who lets a deputy go will still lose its best developers.
WHAT TO DO
What to measure and what to ignore
Groups measure pipelines badly because the meaningful signals are slow and the fast signals are meaningless.
| Measure | Worth tracking | Why |
|---|---|---|
| Internal fill rate on senior seats | Yes, as the headline | It is the only number that describes whether the pipeline works. Track it over three years, not one. |
| Number of people in the program | No | It measures activity, not readiness, and it rises whenever someone needs to demonstrate effort. |
| Second name coverage on critical seats | Yes | The most useful leading indicator available. It moves before the fill rate does. |
| Training hours delivered | No | Average training received actually fell to 40 hours per employee in 2025 from 47 the prior year [16], and neither figure tells you anything about capability. |
| Retention of assessed high potentials | Yes | High potential intention to depart rose from 13% in 2020 to 21% in 2024 and is 3.7X higher where the manager provides no growth [2]. |
| Engagement at the head of department level | Yes | Managers account for at least 70% of engagement variance in their units [6], so this is a forward read on next year’s turnover. |
| Program satisfaction scores | No | Measures the room, not the result. Only around a third of L&D functions are proactive in identifying the performance issue before recommending a solution [16]. |
Measuring it in a language owners accept
The one number to put in front of an owner
Internal fill rate on the critical seat list, over a rolling three years, alongside the external premium paid on the seats that went outside [5]. Those two figures together turn a talent conversation into a commercial one. This is the only register in which it reliably survives a difficult quarter.
A caution on the trailing signals. Leadership readiness has been declining in the DDI data since 2011, with only a slight rebound in 2025 [1], and leader stress is now reported by 71% of leaders, with 40% of those considering leaving leadership altogether [2]. A group that measures its pipeline purely on internal fill rate will look fine right up to the point where the bench walks out. Retention of the assessed bench is the number that gives you a warning.
What to do
Track internal fill rate and second name coverage as the headline pair, and retention of the assessed bench as the early warning. Training hours and program satisfaction belong in an activity log, not a board pack.
Not sure where your bench actually stands?
A confidential conversation about your critical seats, your second name coverage, and where the gaps really are.
Glossary
Bench: The named, assessed group of people who could take a critical seat within a defined window. A list of names with no assessment behind it is a wish list rather than a bench.
Critical seat: A role where a vacancy would materially damage the result, the guest experience, or the relationship with an owner. Usually far fewer seats than the org chart implies.
Second name coverage: The proportion of critical seats with at least two credible internal successors identified. The most useful leading indicator of pipeline health.
Stretch assignment: A job deliberately slightly larger than the person’s demonstrated capability, with support attached and an agreed acceptable failure. The primary mechanism by which people actually build senior capability.
Internal fill rate: The share of senior vacancies filled by internal promotion over a rolling period. The headline outcome measure for a pipeline.
External premium: The additional cost of hiring from outside rather than promoting from within, measured at about 18% to 20% on compensation alone, before search cost and time to performance.
What clients and colleagues say
“
Over the years I have worked with Florian and he has continually provided a service second to none. The caliber of individuals he recommends is always spot on, as he ensures that he understands not only the requirements and expectations of a role but also the importance of the success and growth of the business being related to people.
Daniel Aylmer
Chief Executive Officer, Greater China
“
Florian is one of the most connected and trusted search professionals in hospitality. He takes the time to genuinely understand both the business need and the candidate, which is why his placements last.
Stefan Savic
Hospitality Professional, Asset Management, Development and Strategy
Both quotes are verified public LinkedIn recommendations from clients and colleagues who have worked with Florian Kittler.
About this analysis
The figures in this article are drawn from third party research, DDI, Gallup, Harvard Business Review, Deloitte, the American Hotel and Lodging Association, the World Travel and Tourism Council, and others, each cited inline and listed in full in the Sources section below. Cornerstone Hospitality did not conduct the underlying studies; figures reflect each publisher’s own sample, methodology, and publication date, and are presented here as context for the industry rather than as Cornerstone’s own primary research.
Frequently asked questions about the leadership pipeline in hospitality
Three years before the internal fill rate moves meaningfully and about nine months before the leading indicators do. Second name coverage on critical seats will shift inside a year if the group actually does the assessment work. The temptation is to judge the program on the first year. That is the year in which nothing visible happens by design.
Building is cheaper on almost every measure once the comparison is honest. External hires are paid about 18% to 20% more than comparable internal promotions and take roughly two years to reach the same performance level [5]. The relevant question is not cost but capability: some roles genuinely require a capability the group does not have, and the group should buy those roles in.
Heads of departments and their deputies. That layer has the largest measured effect on engagement and therefore on turnover, because managers account for at least 70% of engagement variance in their business units [6], and hospitality loses 76% of its workforce annually [15]. Almost no group allocates this way, because the executive committee sets the budget.
Partly you do not, and the arithmetic still favors developing them. But the largest controllable factor is the manager: high potential talent is 3.7X more likely to leave within a year when their manager does not regularly provide growth opportunities [2]. Being the group that develops people is also the reason strong people join in the first place.
They predict meaningfully but not perfectly. Structured methods currently show the highest measured operational validity of the common selection instruments, at around .42 [12], and promotions are 1.6X more likely to succeed when assessments inform them [1]. An assessment is an edge, not an oracle, and anyone selling it as certainty is overselling.
By changing what it does to their numbers. Losing a strong deputy to a group move currently penalizes a general manager twice, once in the operation and once in the result. Until the property level visibly rewards developing people, the resistance is entirely rational, and no amount of exhortation will shift it.
Two as the working minimum, three where the seat is genuinely load bearing. One name is a dependency rather than a bench. It tends to evaporate the moment that person takes a call from somebody else.
Building a bench or buying one every time?
If the last three senior vacancies all went outside, that is worth an honest conversation. No commitment, no charge.
Sources
- DDI: Succession Planning Best Practices: How to Close the Leadership Readiness Gap: reports that “only 20% of HR leaders say they have leaders ready to fill their most critical roles” and that “80% of organizations lack confidence in their leadership bench”, while “75% of organizations prioritize internal promotion over external hiring” and internal candidates “can fill only 49% of critical positions immediately”. It also finds promotions are 1.6X more likely to succeed when assessments inform selection, and organizations with strong benches are 2.9X more likely to fill leadership roles internally and 2.8X more likely to outperform financially: ddi.com/blog/succession-planning-best-practices
- DDI: Global Leadership Forecast 2025 Study Signals Looming Leadership Exodus: surveys 10,796 leaders and 2,185 HR professionals across more than 50 countries and 24 industry sectors, reporting 71% of leaders with increased stress, 40% of stressed leaders considering leaving leadership altogether, and trust in immediate managers at “just 29%, a 37% decline since 2022”. It also records high potential intention to depart rising “from 13% in 2020 to 21% in 2024”, with high potential talent 3.7X more likely to leave within a year where the manager does not provide regular growth opportunities: ddi.com/about/media/global-leadership-forecast-2025
- American Hotel & Lodging Association: 65% of surveyed hotels report staffing shortages: surveys 282 hoteliers between 6 December 2024 and 3 January 2025 with Hireology, finding 65% still reporting shortages, 9% describing themselves as “severely understaffed” against 13% in May 2024, hotel employment “nearly 10% below pre pandemic staffing levels”, and 71% carrying open positions at an average of six to seven per property. Housekeeping accounts for 38% of the gaps and front desk 26%, and 72% of respondents say career opportunities in hospitality are better than ever: ahla.com/news/65-surveyed-hotels-report-staffing-shortages
- American Hotel & Lodging Association: Rising Cost, Staffing Challenges Persist for Hotels as Travel Demand Expected to Hold Steady: surveys 246 hoteliers in late February 2026 and finds that “more than half of respondents report their properties are somewhat or severely understaffed”, with labor costs a top concern for 65% and workforce shortages named by 42%. Retention incentives in use include higher wages at 70%, flexible scheduling at 54%, hotel discounts at 54% and enhanced benefits at 31%: ahla.com/news/rising-cost-staffing-challenges-persist-hotels
- Knowledge at Wharton: Why External Hires Get Paid More, and Perform Worse, than Internal Staff: reports Matthew Bidwell’s study “Paying More to Get Less: The Effects of External Hiring versus Internal Mobility”, published in Administrative Science Quarterly and drawn from personnel data in a US investment banking division from 2003 to 2009. External hires are paid “about 18% to 20% more” than comparable internal promotions and need “about two years to get up to speed”, and hiring managers confirm they “typically pay 10% or 20% more to pull people out of positions” where they already have security: knowledge.wharton.upenn.edu/article/why-external-hires-get-paid-more-and-perform-worse-than-internal-staff
- Gallup: Managers Account for 70% of Variance in Employee Engagement: states that “managers account for at least 70% of the variance in employee engagement scores across business units”, drawn from research measuring the engagement of 27 million employees and more than 2.5 million work units over two decades. It also finds about one in 10 people possess high talent to manage, that companies “miss the mark on high managerial talent in 82% of their hiring decisions”, and that talented managers contribute about 48% higher profit than average managers: news.gallup.com/businessjournal/182792/managers-account-variance-employee-engagement
- Gallup: This Fixable Problem Costs U.S. Businesses $1 Trillion: establishes that “the cost of replacing an individual employee can range from one half to two times the employee’s annual salary” and describes that as “a conservative estimate”. It also reports that 52% of voluntarily exiting employees say their manager or organization could have prevented their departure, and 51% say that in the three months before leaving, neither their manager nor any other leader spoke with them about job satisfaction or their future: gallup.com/workplace/247391/fixable-problem-costs-businesses-trillion
- Leadership IQ: Executive Failure Rates: reports a longitudinal study of more than 20,000 new hires across 312 organizations, evaluated by 5,247 hiring managers at 6, 12, 18 and 24 months, finding that “46% of new hires failed within 18 months, only 19% achieved unequivocal success” and that 89% of failures were attributable to attitudinal factors against 11% for technical skill. The leading drivers were coachability at 26%, emotional intelligence at 23%, motivation at 17% and temperament at 15%: leadershipiq.com/blogs/leadershipiq/executive-failure-rates
- Harvard Business Review: Turning Potential into Success: The Missing Link in Leadership Development: by Claudio Fernandez Araoz, Andrew Roscoe and Kentaro Aramaki, reports that “66% of companies invest in programs that aim to identify high potential employees and help them advance” while “only 24% of senior executives at those firms consider the programs to be a success”. It adds that “a mere 13% have confidence in the rising leaders at their firms, down from an already low 17% just three years ago”, and that at the world’s largest corporations “a full 30% of new CEOs are hired from the outside”: hbr.org/2017/11/turning-potential-into-success-the-missing-link-in-leadership-development
- OysterLink analysis of US Bureau of Labor Statistics JOLTS data: Hospitality Workers Quit at a Higher Rate Than Any Other Industry in the U.S.: establishes that “the quit rate for accommodation and food services reached 4.3% in March 2026, the highest among all industries” and “nearly double the private sector average of 2.2%”. Retail trade, the next highest sector, recorded 3.1%, against healthcare at 1.9%, manufacturing at 1.4% and finance at 1.2%. Layoffs in the sector held at 1.3%, matching the national average, so roughly three quarters of separations are people choosing to leave: prnewswire.com/news-releases/hospitality-workers-quit-at-a-higher-rate-than-any-other-industry-in-the-us
- World Travel & Tourism Council: Global Travel & Tourism Growth to Outpace Wider Economy by 1.5 Times Over the Next Decade: published 12 May 2026 with research partner Oxford Economics, forecasts that the sector will “support 376 million jobs worldwide in 2026, representing one in nine jobs globally” and contribute “$12TN to the world economy, accounting for 9.9% of global GDP”. Over the next decade it projects “almost 89 million new jobs globally, accounting for approximately one third of all new jobs expected” across the wider economy: wttc.org/news/global-travel-tourism-growth-to-outpace-wider-economy-by-1-5-times-over-the-next-decade
- Society for Industrial and Organizational Psychology: Is Cognitive Ability the Best Predictor of Job Performance? New Research Says It’s Time to Think Again: reports the revised operational validity estimates from Sackett and colleagues, in which “structured interviews emerged as the strongest predictors of job performance” with a mean operational validity of .42, job knowledge and work sample tests follow at .40, .38 and .33, and “cognitive ability rounded out this list with a validity estimate of .31”. The article explains that earlier meta analytic corrections had systematically inflated these figures: siop.org/tip-article/is-cognitive-ability-the-best-predictor-of-job-performance
- The Future Organization, interview with Michael Watkins: The First 90 Days: Strategies for Leaders in Transition: records Watkins stating that “unaided the process for leaders to reach the breakeven point can take up to six months”, the breakeven point being where a leader contributes as much value as they have consumed. He also observes that “most people spend 10 to 15 years in leadership positions before getting any formal leadership training from their organization”, with the average leader in their late thirties or early forties before any training at all: thefutureorganization.com/the-first-90-days-strategies-for-leaders-in-transition
- Korn Ferry Institute: Stronger Leadership, Stronger Climate, Better Results: analyzes “data from over 2,700 individuals across 541 teams” and finds that “team climate accounted for up to 31% of the variation in team level engagement”. It reports that the right leadership characteristics and team environment “can lift engagement scores by up to 42 percentile points”, and that leaders scoring high on Presence, Agility and Striving produced team climates “approximately 30 percentile points stronger” than lower scoring leaders: kornferry.com/institute/stronger-leadership-stronger-climate-better-results
- Deloitte: Frontline Workforce Trends in Airlines, Hospitality, and Restaurants: reports that “80% of restaurant workers and 76% of hospitality workers leave their job within a year”, and that “66% of executives and managers say most recent hires were not fully prepared, and that lack of experience was the most common failing”. It also finds 82% of workers naming feeling happy and engaged at work as the key driver of productivity, and 75% hoping for greater stability in the face of change: deloitte.com/us/en/Industries/consumer/articles/frontline-workforce-human-capital-trends
- Training magazine: 2025 Training Industry Report: records that “U.S. training expenditures jumped 4.9 percent to $102.8 billion in 2025” and that “organizations spent $874 per learner this year compared with $774 per learner in 2024”, while average training received fell to “40 hours of training per year vs. 47 hours last year”. Management and supervisory training took 13 percent of the average budget. The survey covers a weighted universe of 152,572 US companies with 100 or more employees: trainingmag.com/2025-training-industry-report
About the author

Written by
Florian Kittler, ISHC
Managing Partner, Cornerstone Hospitality · Global Practice Leader, Hospitality, Travel and Leisure
Florian leads Cornerstone International Group’s global Hospitality, Travel and Leisure Practice. He brings seventeen years of senior hospitality experience, including Marriott, Hyatt, IHG, Mandarin Oriental, and Shangri-La Hotels and Resorts, and sixteen years in retained executive search. He is bilingual in English and German and works across Europe, the Middle East, the Americas, and Asia Pacific.
Related reading
Cornerstone’s leadership development practice for hospitality groups building the bench described above.
The Hospitality Industry’s Leadership Skills Gap in 2026
A closer look at where the industry wide skills gap is widest, and what is driving it.
AI Is Quietly Destroying the Hotel Leadership Pipeline
How automation is changing which roles actually build the judgment a pipeline depends on.